 Pythonとは Pythonとは
 基本的な使い方
・ IDLE
・ Jupyter Notebook
・ Markdown
・ コマンドプロンプトで実行
・ 仮想環境の構築
・ 仮想環境でIDLEを実行
 ライブラリのインストール
・ pipの使い方
・ numpy , matplotlib等
・ graphviz
・ pytorch
・ Mecab
 Pythonの関数: 一覧
 共通関数
・ append , extend
・ class
・ copy
・ csv.reader
・ csv.writer
・ def , return
・ dict , defaultdict
・ enumerate
・ exit
・ for
・ if
・ import
・ in
・ input
・ lambda
・ len
・ list
・ min/max
・ OrderedDict
・ open/close
・ os
・ pickle
・ print
・ range
・ re.split
・ read/readline
・ round/floor/ceil
・ split
・ sys.argv
・ time
・ while
・ write
・ zip
・特殊メソッド
・ __name__
・ __iter__ , __next__
・ 正規表現、メタ文字
・ データの型の種類
・ 四則演算 (+ , - , * , /)
・ コメントアウト (# , ''')
 numpy
・ append
・ arange
・ argmax/argmin
・ array
・ asfarray
・ astype , dtype
・ digitize
・ dot
・ hstack/vstack
・ linalg.solve
・ linspace
・ max,min
・ mean
・ meshgrid
・ mgrid
・ ndim
・ ndmin
・ pad
・ poly1d
・ polyfit
・ prod
・ random
・ reshape
・ savetxt/loadtxt
・ shape
・ std
・ transpose
・ where
・ zeros/zeros_like
 scipy
・ expit
・ imread
・ interpolate
・ signal.square, sawtooth
 matplotlib
・ contour
・ imshow
・ figure
・ pcolormesh
・ plot
・ quiver
・ scatter
 scikit-learn
・ GaussianNB
・ KMeans
・ KNeighborsClassifier
・ SVC
・ tree
 chaospy chaospy
 keras keras
 chainer chainer
 chainerrl chainerrl
 pandas
・ データ抽出
・ concat
・ DataFrame
・ read_excel
 pytorch
・ BCELoss , MSELoss
・ Embedding
・ device
・ Sequential
・ Dataset, Dataloader
・ RNN, LSTM
 OpenAI gym
・ Blackjack-v0
・ CartPole-v0
 seaborn
・ pairplot
 tkinter
・ frame, grid
・ 画像表示
・ 画像を切り取り表示
・ 画像を保存
 目的別
・ ステップ関数
・ 矩形波, 三角波
・ 1 of K 符号化法
・ 線形補間
・ 配列に番号をつける
・ ベクトル場を描く
・ 線形回帰, 多項式回帰
・ Bluetooth接続
|
・In English
■scatterの説明
散布図を描画します。
■scatterを使用した具体例
import numpy as np
import matplotlib.pyplot as plt
x = np.random.rand(10) #ランダムの数字の配列を生成
y = np.random.rand(10)
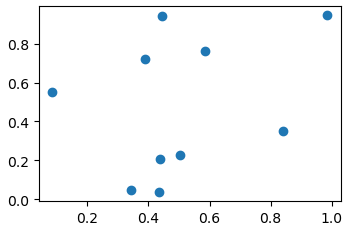
plt.scatter(x, y) #散布図を描画
plt.show()
結果は以下のとおり。

■scatterとplotとの違い
scatterに似たmatplotlibの関数に"plot"があります。plotはグラフ描画の関数ですが、散布図も描くことができます。
上記プログラムを以下のとおり変更します。
plt.scatter(x, y) #この部分を以下の様に変更する
↓↓↓
plt.plot(x, y, "o")
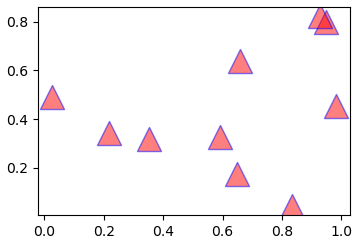
こうする事で上記と同様の散布図が描けたと思います。それではscatterのメリットはというと、plotより詳細な設定が出来るというところです。例えば以下。
s:サイズ
c:色
alpha:透過率
edgecolors:枠の色
marker: マーカーの形
plt.scatter(x, y, s=300, c="red", alpha=0.5,edgecolors="blue", marker="^")
結果は以下のとおり。

■color, cmapの使い方
色の表現を駆使する事で、3次元表現ができます。
import numpy as np
import matplotlib.pyplot as plt
x = np.random.rand(10) #ランダムの数字の配列を生成
y = np.random.rand(10)
z = np.random.rand(10)
col = plt.cm.viridis
plt.scatter(x, y, c=z, cmap=col) #散布図を描画
plt.colorbar()
plt.show()
結果は以下のとおり。

サブチャンネルあります。⇒ 何かのお役に立てればと
 Pythonとは Pythonとは
 基本的な使い方
・ IDLE
・ Jupyter Notebook
・ Markdown
・ コマンドプロンプトで実行
・ 仮想環境の構築
・ 仮想環境でIDLEを実行
 ライブラリのインストール
・ pipの使い方
・ numpy , matplotlib等
・ graphviz
・ pytorch
・ Mecab
 Pythonの関数: 一覧
 共通関数
・ append , extend
・ class
・ copy
・ csv.reader
・ csv.writer
・ def , return
・ dict , defaultdict
・ enumerate
・ exit
・ for
・ if
・ import
・ in
・ input
・ lambda
・ len
・ list
・ min/max
・ OrderedDict
・ open/close
・ os
・ pickle
・ print
・ range
・ re.split
・ read/readline
・ round/floor/ceil
・ split
・ sys.argv
・ time
・ while
・ write
・ zip
・特殊メソッド
・ __name__
・ __iter__ , __next__
・ 正規表現、メタ文字
・ データの型の種類
・ 四則演算 (+ , - , * , /)
・ コメントアウト (# , ''')
 numpy
・ append
・ arange
・ argmax/argmin
・ array
・ asfarray
・ astype , dtype
・ digitize
・ dot
・ hstack/vstack
・ linalg.solve
・ linspace
・ max,min
・ mean
・ meshgrid
・ mgrid
・ ndim
・ ndmin
・ pad
・ poly1d
・ polyfit
・ prod
・ random
・ reshape
・ savetxt/loadtxt
・ shape
・ std
・ transpose
・ where
・ zeros/zeros_like
 scipy
・ expit
・ imread
・ interpolate
・ signal.square, sawtooth
 matplotlib
・ contour
・ imshow
・ figure
・ pcolormesh
・ plot
・ quiver
・ scatter
 scikit-learn
・ GaussianNB
・ KMeans
・ KNeighborsClassifier
・ SVC
・ tree
 chaospy chaospy
 keras keras
 chainer chainer
 chainerrl chainerrl
 pandas
・ データ抽出
・ concat
・ DataFrame
・ read_excel
 pytorch
・ BCELoss , MSELoss
・ Embedding
・ device
・ Sequential
・ Dataset, Dataloader
・ RNN, LSTM
 OpenAI gym
・ Blackjack-v0
・ CartPole-v0
 seaborn
・ pairplot
 tkinter
・ frame, grid
・ 画像表示
・ 画像を切り取り表示
・ 画像を保存
 目的別
・ ステップ関数
・ 矩形波, 三角波
・ 1 of K 符号化法
・ 線形補間
・ 配列に番号をつける
・ ベクトル場を描く
・ 線形回帰, 多項式回帰
・ Bluetooth接続
|
|
|