How to use matplotlib's "scatter" function. python |
|||||||
・pip ・MeCab ・class ・pickle ・read/readline ・asfarray ・digitize ・expit ・linalg.solve ・meshgrid ・mgrid ・ndmin ・pad ・poly1d ・polyfit ・prod ・shape ・figure ・pcolormesh ・scatter ・BCELoss, MSELoss ・device ・Embedding ・TensorDataset, Dataloader ・RNN, LSTM ・SVC ・GaussianNB ・interpolate ・postscript ・image display ・frame, grid ・Crop Image ・linear interpolation ・Hysteresis switch ・Square/Triangle wave ・CartPole-v0 ・1 of K Coding |
■Description of the scatter function
Draw a scatterplot.
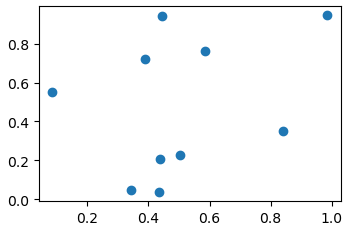
■Specific example using scatter function
import numpy as np
■Difference between "scatter" and "plot"
A matplotlib function similar to scatter is "plot".
plot is a graph drawing function that can also draw scatterplots.
Change the above program as follows.
plt.scatter(x, y) #change as follows
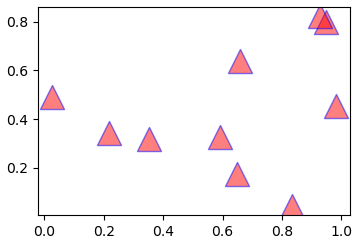
"s":size
plt.scatter(x, y, s=300, c="red", alpha=0.5,edgecolors="blue", marker="^")
|
|
|||||