How to use figure function(python, matplotlib). Draw multiple graphs |
|||||||
・pip ・MeCab ・class ・pickle ・read/readline ・asfarray ・digitize ・expit ・linalg.solve ・meshgrid ・mgrid ・ndmin ・pad ・poly1d ・polyfit ・prod ・shape ・figure ・pcolormesh ・scatter ・BCELoss, MSELoss ・device ・Embedding ・TensorDataset, Dataloader ・RNN, LSTM ・SVC ・GaussianNB ・interpolate ・postscript ・image display ・frame, grid ・Crop Image ・linear interpolation ・Hysteresis switch ・Square/Triangle wave ・CartPole-v0 ・1 of K Coding |
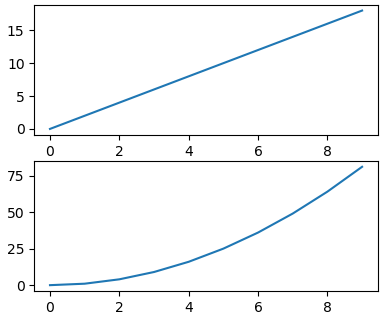
■Figure function description
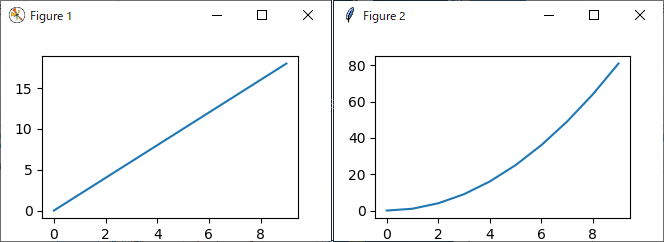
Draw multiple graphs.
import matplotlib.pyplot as plt
Example (1)
x=np.arange(10)
x=np.arange(10)
|
|
|||||