How to use numpy's "mgrid" function |
|||||||
・pip ・MeCab ・class ・pickle ・read/readline ・asfarray ・digitize ・expit ・linalg.solve ・meshgrid ・mgrid ・ndmin ・pad ・poly1d ・polyfit ・prod ・shape ・figure ・pcolormesh ・scatter ・BCELoss, MSELoss ・device ・Embedding ・TensorDataset, Dataloader ・RNN, LSTM ・SVC ・GaussianNB ・interpolate ・postscript ・image display ・frame, grid ・Crop Image ・linear interpolation ・Hysteresis switch ・Square/Triangle wave ・CartPole-v0 ・1 of K Coding |
■Description of the mgrid function
Generates a grid array.
import numpy as np
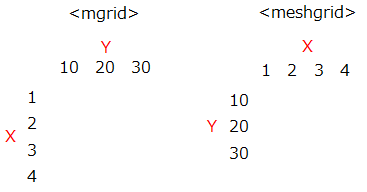
<Difference between mgrid function and meshgrid function>
A function similar to mgrid is the meshgrid function.
The difference is that mgrid can only create an array with equal intervals by deciding the start point and end point, but meshgrid can create an array with arbitrary intervals.
Instead, mgrid is simple to write.
|
|
|||||