How to use pcolormesh. Apply a grid color scheme to a graph


Python
library
pip

MeCab

Common
class

pickle

read/readline

numpy
asfarray

digitize

expit

linalg.solve

meshgrid

mgrid

ndmin

pad

poly1d

polyfit

prod

shape

matplotlib
figure

pcolormesh

scatter

pytorch
BCELoss, MSELoss

device

Embedding

TensorDataset, Dataloader

RNN, LSTM
scikit-learn
SVC

GaussianNB

scipy
interpolate
tkinter
postscript

image display

frame, grid

Crop Image

other
linear interpolation

Hysteresis switch

Square/Triangle wave

OpenAI gym
CartPole-v0

By purpose
1 of K Coding


Release date:2023/12/10         

In Japanese


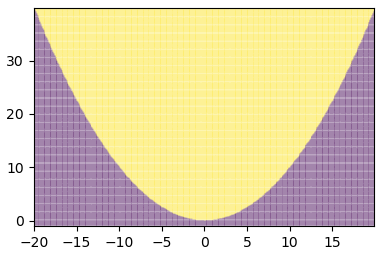
■Description of the pcolormesh function

Adds a grid color scheme to the graph. This is useful when you want to visualize the boundaries of a graph.

■Specific example using pcolormesh function

import numpy as np
import matplotlib.pyplot as plt

X, Y = np.mgrid[-20:20:0.1, -1:40:0.1] # Define the X and Y axes
Z = Y-0.1*X*X >0

plt.pcolormesh(X, Y, Z,alpha=0.1) # Color according to the Z value. alpha is the transmittance.
plt.show()


The results are as follows.


List of related articles


Python
library
pip

MeCab

Common
class

pickle

read/readline

numpy
asfarray

digitize

expit

linalg.solve

meshgrid

mgrid

ndmin

pad

poly1d

polyfit

prod

shape

matplotlib
figure

pcolormesh

scatter

pytorch
BCELoss, MSELoss

device

Embedding

TensorDataset, Dataloader

RNN, LSTM
scikit-learn
SVC

GaussianNB

scipy
interpolate
tkinter
postscript

image display

frame, grid

Crop Image

other
linear interpolation

Hysteresis switch

Square/Triangle wave

OpenAI gym
CartPole-v0

By purpose
1 of K Coding