The kernel method is a method for solving nonlinear separation (regression) problems.
After linearly separating data by mapping it to a high-dimensional space, nonlinear separation is possible by returning it to the original low-dimensional space.
When performing linear separation by mapping to a high-dimensional space, it is necessary to calculate the inner product (covariance), resulting in a huge amount of calculation.
However, by using a kernel function, nonlinear separation can be performed without performing extensive calculations. This is also called a kernel trick.
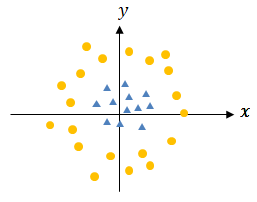
Explain the image of linear separation. For example, the following data cannot be linearly separated as is.
If this is expressed as a new axis, which is the Z axis (=x2+y2), as shown below, it becomes linearly separable.
After performing linear separation in this state, nonlinear separation is possible by returning to the original low-dimensional space.
Support vector machines are a method of classification that utilizes this idea.
<Types of kernel functions>
Kernel functions include linear kernels, polynomial kernels, Gaussian kernels, and RBF (Radial Basis Function) kernels. The RBF kernel is as follows.
■Regression procedure using kernel method
As a specific example, I will explain how to regress to a sine wave from a sampled point.
<step1>
Sample the data (this time) at 40 points. Assign a number to each point for convenience.
<step2>
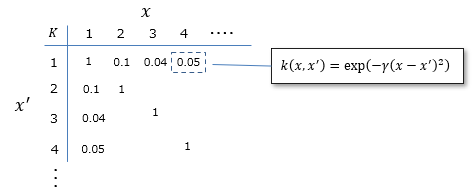
Calculate the kernel function values of all other sample points x' for each sample point x, and arrange the results like a matrix below.
This is called a kernel matrix or Gram matrix, which is a covariance matrix and represents the correlation between sample points. (The closer the sample point values are, the closer the output will be). <step3>
Using the kernel matrix, calculate the regression function parameter "w" based on the following formula:
<step4>
Perform regression based on the parameter w.
Calculate the value of the kernel function for the point to estimate x' and all sample points x, respectively.
The sum of the results of multiplying them by w is the value of y at the point x' to estimate.
■Implementation example of regression using kernel method (python)
The environment and libraries used are as follows.
import numpy as np
from matplotlib import pyplot as plt
from itertools import product
def kernel(x, xd): # kernel function
K = np.zeros([len(x), len(xd)])
for i, j in product(range(len(x)), range(len(xd))):
K[i][j] = np.exp(-theta * (x[i]-xd[j])**2)
return K
N = 40 # The number of samples
lamda = 0.1
theta = 1
X_smpl = np.random.uniform(-2*3.14, 2*3.14, N) # sample x value
Y_smpl = np.sin(X_smpl) # sample y value
X_est = np.linspace(-2*3.14, 2*3.14, 100) # X value you want to estimate
K = kernel(X_smpl, X_smpl) # Kernel function value calculation
W = np.dot(np.linalg.inv(K + lamda * np.eye(N)),Y_smpl) # Parameter calculation
Y_est = np.dot(kernel(X_est, X_smpl),W) # estimated value
<Program execution results>
The results are as follows. The blue dot is the sample point, the red line is the estimated value, and the blue line is the original line (although it overlaps with the red line and is hard to see).
Although the estimation results vary depending on the sampled location, it can be seen that the estimation is generally accurate.