When performing regression with a small number of data, it may not be possible to perform accurate fitting to the target model.
Nonparametric regression is a method that updates the function with better accuracy from the obtained data.
Gaussian process regression is a type of nonparametric regression model in which the values obtained by the regression model have a range according to a Gaussian distribution.
When the number of data is small, the variance of the Gaussian distribution is large, and as the number of data increases, the reliability of the data increases, so the variance of the Gaussian distribution becomes small.
■An example implementation of Gaussian process regression in python
import numpy as np
from matplotlib import pyplot as plt
from itertools import product
def kernel(x, xd): # kernel function
K = np.zeros([len(x), len(xd)])
for i, j in product(range(len(x)), range(len(xd))):
K[i][j] = theta[0]*np.exp(-1*(x[i] - xd[j])**2 /theta[1])+(theta[2]*int(x[i]==xd[j]))
return K
N = 20 # The number of samples
theta = np.array([1, 0.4, 0.1]) # coefficient
X_smpl = np.random.uniform(-2*3.14, 2*3.14, N) # sample X value
Y_smpl = np.sin(X_smpl) # sample Y value
X_est = np.linspace(-2*3.14, 2*3.14, 100) # X value you want to estimate
std = np.zeros([len(X_est)]) # standard deviation
K = kernel(X_smpl, X_smpl)
W = np.dot(np.linalg.inv(K), Y_smpl) # parameter
k = kernel(X_est, X_smpl)
mu = np.dot(k, W) # mean value
KK = np.dot(k, np.linalg.inv(K))
for i in range(len(X_est)):
std[i] = np.sqrt(theta[0] + theta[2] - np.dot(KK[i], k[i].T)) # standard deviation
plt.scatter(X_smpl, Y_smpl)
plt.plot(X_est, np.sin(X_est), c='blue')
plt.plot(X_est, mu, color='red') # Plot of mean values
plt.fill_between(X_est, mu + std, mu - std, alpha=.2, color='green') # Bound Regression Confidence
plt.show()
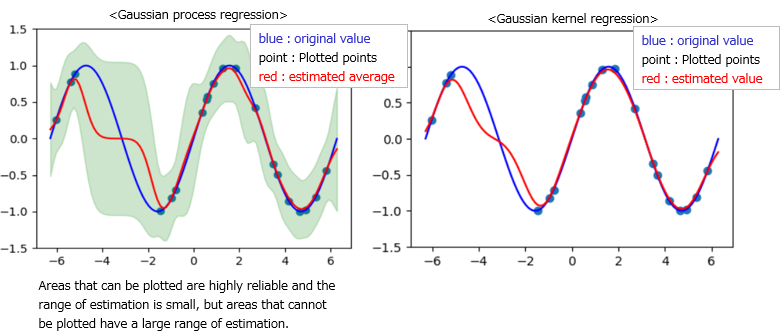
<Program execution result>
The results are as follows. It represents a comparison with Gaussian kernel regression.
Gaussian process regression considers areas with few plot points to be unreliable data and widens the range of estimated values (green areas).
Conversely, areas with many plotted points reduce the range of estimated values.