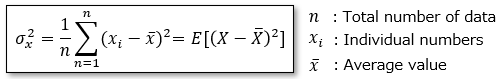
The variance σ2 is an index showing the degree of data dispersion and is shown below. E means expected value (average).
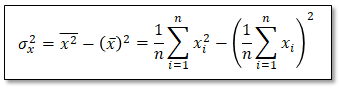
The above formula can be transformed as follows.
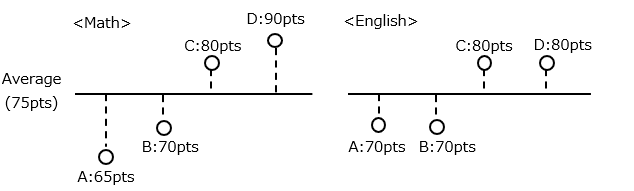
Let's take a concrete example of what variance means. If the scores of the four math and national language tests are as follows. Both have the same average score of 75 points.
The variance is the sum of the squares of the distances from the mean value divided by the number of people,
that is, the mean square of the distances from the mean value, so a large value means that there is a large variation from the mean value.
In this example, it seems that the variance value of the English is smaller than that of mathematics.
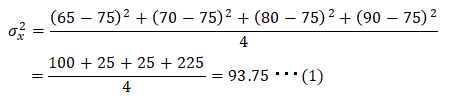
Let's actually calculate.
■Variance of math scores
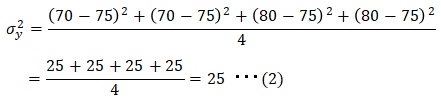
■Variance of English scores
It turned out that the variance value is certainly smaller in the English.
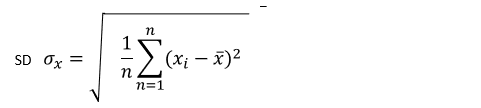
■Standard Deviation:SD
The standard deviation is the square root of the variance, and is given by the following equation.
In this case, the unit of variance was "score2", but by taking the square root, the unit becomes "score", so it is easy to imagine the degree of variation, which is a characteristic of standard deviation.
Here is how to draw a normal distribution from these data.
■Covariance
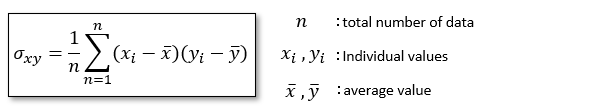
Covariance is a measure of the correlation between two types of data, as shown in the following equation.
It can also be expressed as follows.
If this value is positive, then when one value increases, the other value also increases, a positive correlation.
If this value is negative, an increase in one value causes a decrease in the other, a negative correlation.
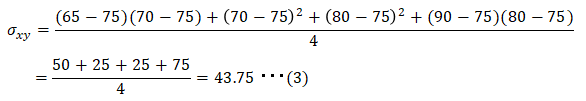
As a concrete example, I will use the example of the math and English scores used above.
The calculation results are as follows. As a result, we can see that there is a positive correlation between English scores and math scores.
■Correlation coefficient
I was able to know the correlation between the two types of data by calculating the covariance, but it is difficult to imagine how strong the correlation is from the size of the value.
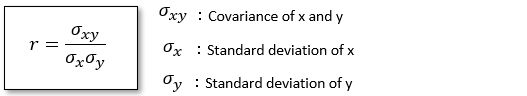
Therefore, the correlation coefficient is obtained by normalizing the values as shown below.
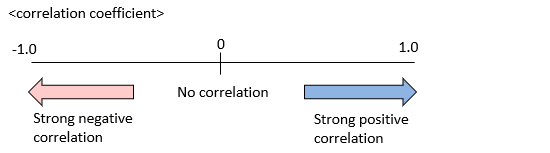
Correlation coefficients range from -1 to 1 and have the following relationship.
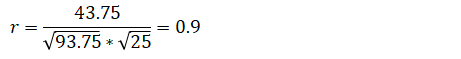
Let's do the actual calculation using the above example. From (1), (2), and (3), we get
It was found that there is a strong positive correlation between the math score and the English score (the higher the math score, the higher the English score).
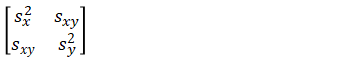
■Variance-covariance matrix
In this example, we have seen the variance σx2 of the math scores, the variance σy2 of the English scores, and the variance These are organized and summarized in an easy-to-understand manner as shown below, and this is called the variance-covariance matrix.
If there are three variables, it will be as follows.