Weibull distribution, Weibull probability paper |
|||||||||||
standard deviation
|
・In Japanese
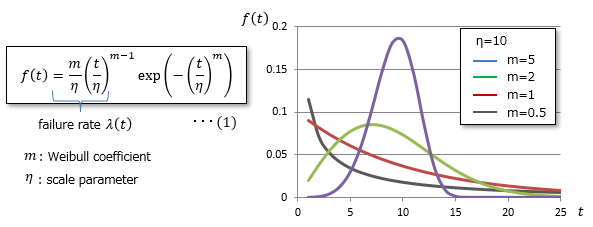
■What is Weibull distribution?
The Weibull distribution is a failure occurrence probability distribution proposed by Swedish scholar W. Weibull, and is expressed by the following formula as follows: "The failure of a component with a complex mechanism follows the failure of the weakest part."
The chain breaking was caused by breaking the weakest part of the ring, also called the weakest link theory.
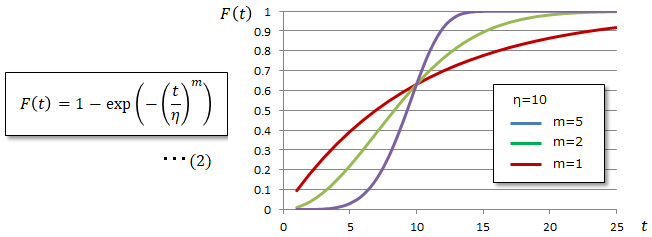
<cumulative distribution function:CDF>
The cumulative distribution function is the cumulative value of probabilities within a given range, with a cumulative value of 1 over the entire range. The horizontal axis is period.
It is used to estimate the failure rate for a given period after the product is released, and is sometimes called, for example, the 3-year CDF. ■What is Weibull probability paper?
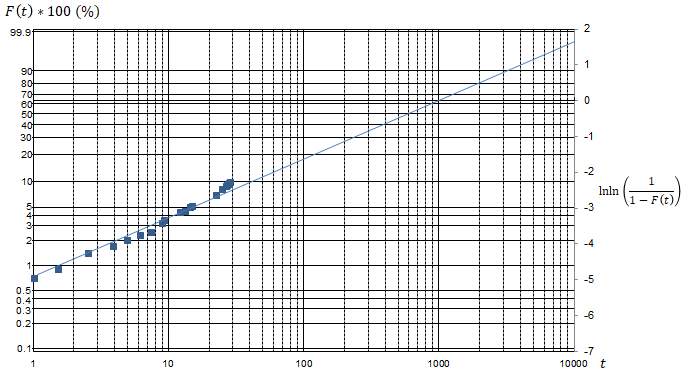
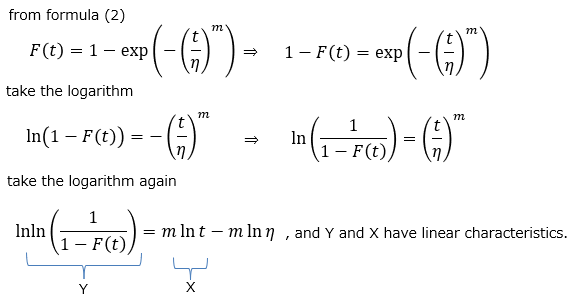
When examining the failure rate of a component, it may be difficult to determine whether it follows the Weibull distribution from the probability density function and cumulative distribution function shown above. Therefore, the Weibull probability paper is a tool for judging the suitability to the distribution by expressing the Weibull distribution on a straight line.
A sample of Weibull probability paper is as follows.
|
|
|||||||||