What is Bessel Filter?


Control theory

Transfer function

Analog filter
Low Pass Filter
・First-order delay system
 ・Transfer function

 ・Bode plot

・secondary delay system
 ・Transfer function

 ・Bode plot

Butterworth filter

Bessel filter

High Pass Filter
Lagged derivative

All pass filter
 ・Transfer function

 ・Pade approximation

Notch filter

Band pass filter


Release date:2023/7/22         

In Japanese
<Premise knowledge>
Transfer function
Basics of how to draw Bode plots
How to draw a Bode plot in Scilab


■What is Bessel Filter?

The Bessel filter has no ripple in the passband, and the gain decays smoothly from the flat region to the attenuation region. Therefore, it has characteristics that are easy to stabilize even in transient. On the other hand, the attenuation characteristic is gentler than that of the Butterworth filter, so it is not suitable for strong attenuation.

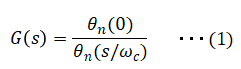
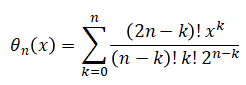
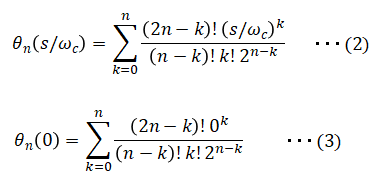
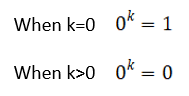
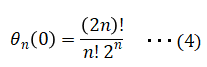
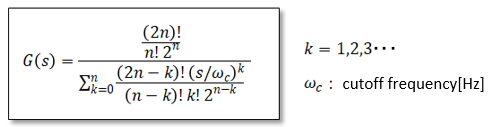
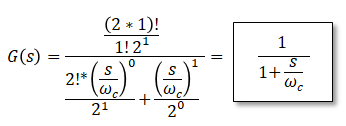
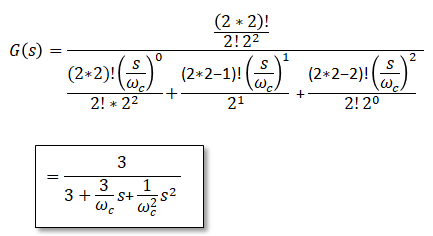
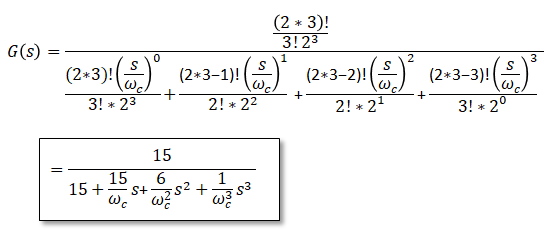
■Bessel filter transfer function
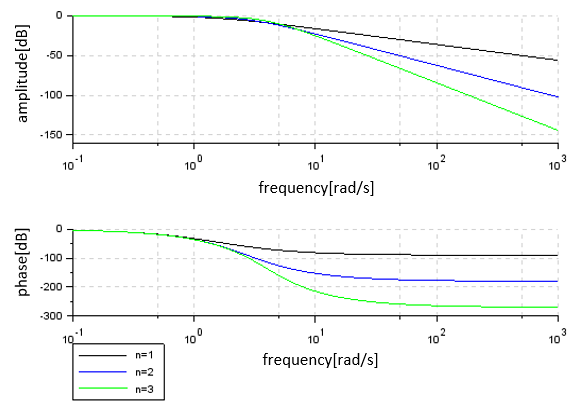
As below.


θn is called an inverse Bessel polynomial and is as follows.


Therefore,


Here, in equation (3), we can see that only k=0 takes a value.


Therefore, equation (3) is as follows.


Substituting (2) and (4) into (1) gives the final transfer function:


<When n=1>


<When n=2>


<When n=3>


■Bode Plot of Bessel Filter

A Bode plot drawn in Scilab looks like this: set wc=10.

==============================
s=poly(0,'s');
p=syslin('c',1/(s/10+1));
q=syslin('c',3/(s^2/10^2+3/10*s+3));
r=syslin('c',15/(s^3/10^3+6/10^2*s^2+15/10*s+15));
bode([p;q;r],0.1,1000,['n=1';'n=2';'n=3']);
==============================


List of related articles


Control theory

Transfer function

Analog filter
Low Pass Filter
・First-order delay system
 ・Transfer function

 ・Bode plot

・secondary delay system
 ・Transfer function

 ・Bode plot

Butterworth filter

Bessel filter

High Pass Filter
Lagged derivative

All pass filter
 ・Transfer function

 ・Pade approximation

Notch filter

Band pass filter