What is Band Pass Filter (BPF)? |
|||||||||||
・First-order delay system ・Transfer function ・Bode plot ・secondary delay system ・Transfer function ・Bode plot ・Butterworth filter ・Bessel filter ・Lagged derivative ・Transfer function ・Pade approximation |
・In Japanese
■What is a bandpass filter?
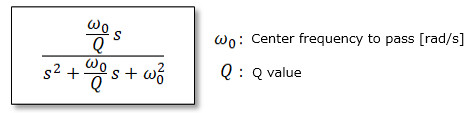
A bandpass filter is a filter that allows only specific frequencies to pass, and is expressed by the transfer function below.
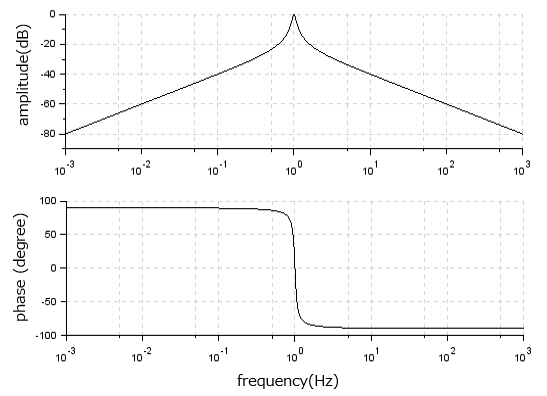
■Bode plot of bandpass filter
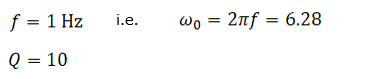
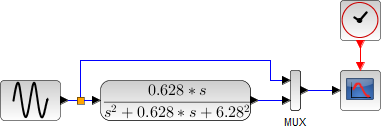
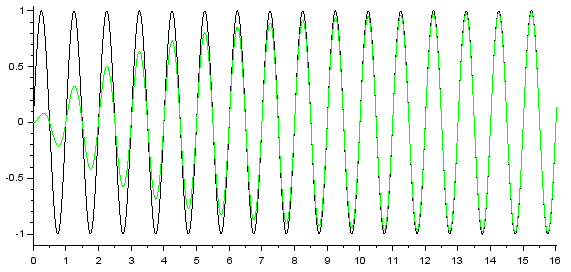
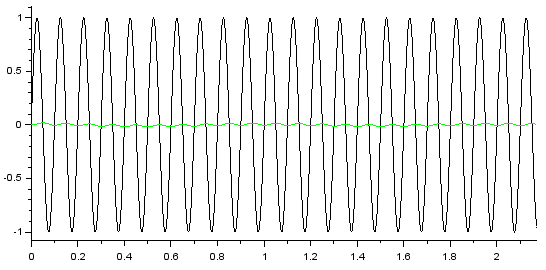
The parameters are as follows. ■Simulating the operation of a bandpass filter with Scilab
Create it in Scilab as follows.
|
|
|||||||||