Butterworth Filter


Control theory

Transfer function

Analog filter
Low Pass Filter
・First-order delay system
 ・Transfer function
 ・Bode plot
・secondary delay system
 ・Bode plot
Butterworth filter
Bessel filter
All pass filter
 ・Transfer function
 ・Pade approximation
Notch filter
Band pass filter

Release date:2022/8/12         

 ・In Japanese
<Premise knowledge>
 ・Transfer function
 ・How to draw a Bode plot
 ・How to draw a Bode plot using Scilab


■Butterworth Filter is

Butterworth filters are widely used as easy-to-handle filters because they are flat (maximum flatness) with no ripple in the passband and have characteristics that gradually attenuate with respect to frequency. 
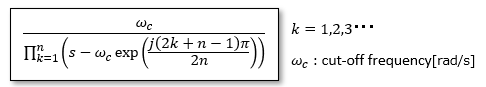
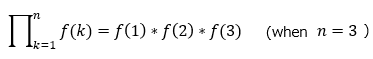
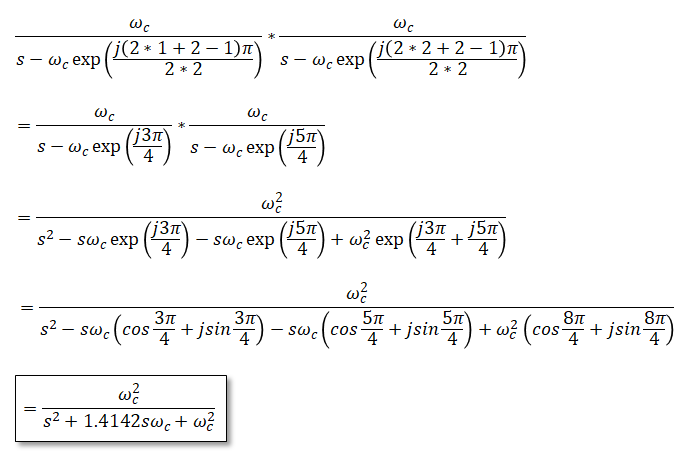
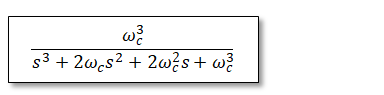
The transfer function is below. It is possible to express from 1st order to nth order.
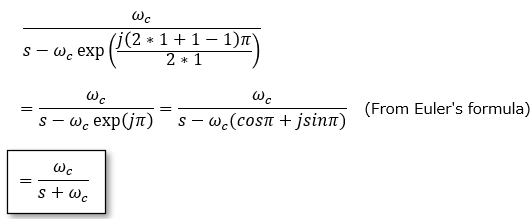
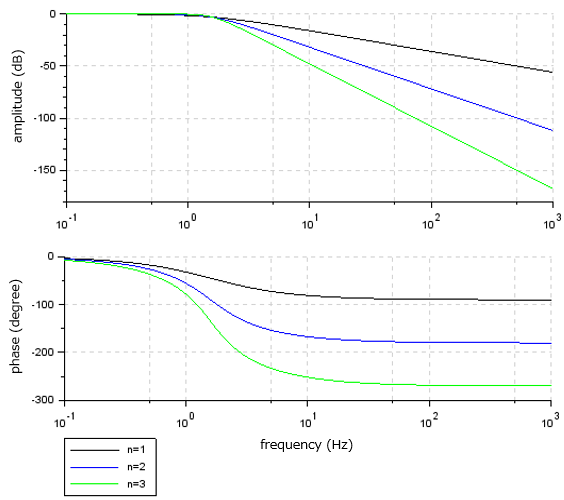


Here, a symbol like π is a multiplication, and indicates the multiplication of functions as follows.


Specific calculation examples of multiplication are as follows.

<when n=1>


<when n=2>


<when n=3>
The calculation process is explained here, and the results are as follows.


■Bode Plot of Butterworth Filter

A Bode plot drawn with Scilab is as follows. wc=10.

==============================
s=poly(0,'s');
p=syslin('c',10/(s+10));
q=syslin('c',10^2/(s^2+1.4142*10*s+10^2));
r=syslin('c',10^3/(s^3+2*10*s^2+2*10^2*s+10^3));
bode([p;q;r],0.1,1000,['n=1';'n=2';'n=3']);
==============================

The results are as follows.


List of related articles


Control theory

Transfer function

Analog filter
Low Pass Filter
・First-order delay system
 ・Transfer function
 ・Bode plot
・secondary delay system
 ・Bode plot
Butterworth filter
Bessel filter
All pass filter
 ・Transfer function
 ・Pade approximation
Notch filter
Band pass filter