|
・In Japanese
Prerequisite knowledge
・What is a neural network?
・What is Python?
■What is MNIST?
MNIST is a famous website by Yann LeCun, a researcher in neural networks, which contains handwritten numbers from 1 to 9 digitized for use in machine learning.
There are 60,000 pieces of data for training and 10,000 pieces of data for testing.
http://yann.lecun.com/exdb/mnist/
■MNIST Dataset Description
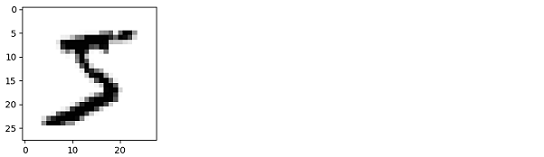
One image data is expressed as a total of 784 pixels of data, 28 pixels vertical x 28 pixels horizontal, with values between 0 and 255, as shown below.
However, the data format on the above site is a little difficult to handle, so I have prepared a csv/text file here. You can use either one.
- CSV file: Training data, Test data
- Text file: Training/Test data
The CSV file is in the following format, with one image data per line. The text data is a list of numbers, and the data up to the line break is one image data.

The breakdown of the data is as follows:

■Implementation example in python
①For csv data
The image above will be output.
import numpy as np
import matplotlib.pyplot as plt
training_file = open("mnist_train_data.csv", 'r') # Open training data
training_list = training_file.readlines() # Read data
training_file.close() # Close file
data= training_list[0].split(',') # Take out row 0 and use split to separate data with commas (,)
img= np.asfarray(data[1:]).reshape((28,28)) # Take the second data from row 0 and arrange it in 28x28
plt.imshow(img, cmap='Greys') # Display the image in grayscale
plt.show() &nb sp; # Show image
②For text data
import numpy as np
import matplotlib.pyplot as plt
train = np.loadtxt('mnist_train.txt') # Load training data
img = train.reshape(60000, 28, 28) # Reshape data
plt.imshow(img[0], cmap='Greys') # Display image in grayscale
plt.show() # Show image
③When using keras
The library keras has a MNIST dataset, so you can use that. (Needs to install keras)
from keras.datasets import mnist
import matplotlib.pyplot as plt
(train_img, train_ans), (test_img, test_ans) = mnist.load_data() # Load training data
plt.imshow(train_img[0], cmap='Greys') # Display images in grayscale
plt.show() # Show image
|