How to derive a spline curve, example using python


Mathematics

Release date:2024/3/24         

 ・In Japanese
Prerequisite knowledge
 ・Inverse matrix
 ・Solving simultaneous equations


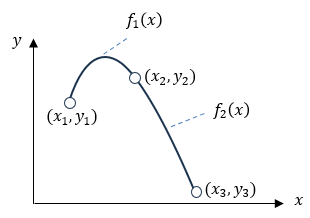
■What is a spline curve?

A spline curve is a line that smoothly interpolates points on a graph. In this case, interpolation is often performed using a cubic curve. A curve that passes through the start and end points but does not pass through the points in between is called a B-spline.


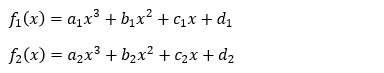
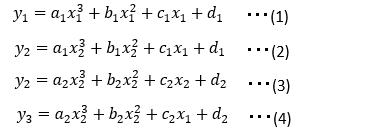
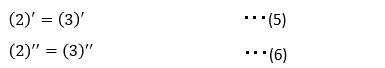
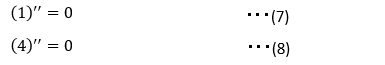
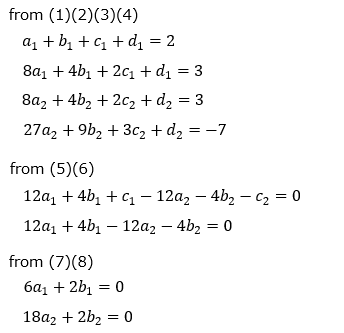
■How to derive spline curves

Consider the above example. We need to derive the coefficients of the following two cubic curves.


Since there are 8 unknown coefficients, we need to create 8 equations. First, assuming that the values of x and y are known, we can formulate the following four equations.


Next, in order to connect the two functions smoothly, the following must hold true at the point that the two functions share.


By setting the start and end points of the graph as shown below, you can connect the entire graph smoothly.


By solving the above simultaneous equations, we can obtain two cubic curves.

■Python example of spline curve

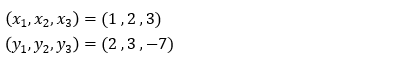
In the above graph, the value of each point is as follows.


The above can be expressed as a matrix as follows.


In the above, we can calculate the solution to the simultaneous equations by using the inverse matrix (Click here for details). From here on, we will use python to calculate. The code is below.

import numpy as np
import matplotlib.pyplot as plt

# Calculate coefficient k of spline curve
A = np.array([[1, 1, 1, 1, 0, 0, 0, 0],
    [8, 4, 2, 1, 0, 0, 0, 0],
    [0, 0, 0, 0, 8, 4, 2, 1],
    [0, 0, 0, 0, 27, 9, 3, 1],
    [12, 4, 1, 0, -12, -4, -1, 0],
    [12, 4, 0, 0, -12, -4, 0, 0],
    [6, 2, 0, 0, 0, 0, 0, 0],
    [0, 0, 0, 0, 18, 2, 0, 0]])

b = np.array([2, 3, 3, -7, 0, 0, 0, 0])
k = np.linalg.solve(A, b)

# Spline curve calculation
f1x = np.arange(1, 2, 0.01)
f1y = k[0]*f1x**3 + k[1]*f1x**2 + k[2]*f1x + k[3]

f2x = np.arange(2, 3, 0.01)
f2y = k[4]*f2x**3 + k[5]*f2x**2 + k[6]*f2x + k[7]

# Joining curves
f3x = np.append(f1x,f2x)
f3y = np.append(f1y,f2y)

# Drawing spline curves
plt.plot(f3x , f3y)
plt.plot([1, 2, 3], [2,3,-7], 'o')

plt.show()


The results are as follows.


List of related articles


Mathematics