|
・In Japanese
Block list
■Block
Output/Display

■Description
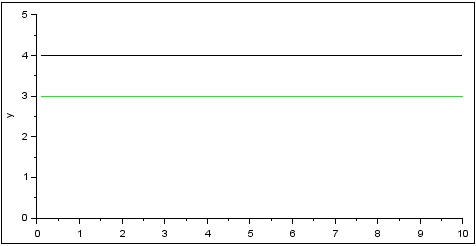
Displays the input signal on a graph.
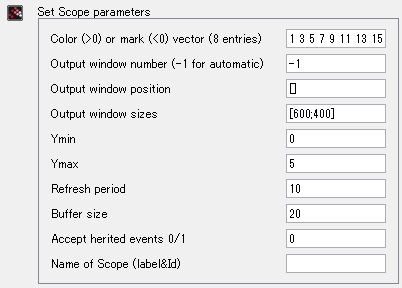
<Parameter settings>
Write to the extent of your understanding.
Output window sizes: Specify the size of the graph
Ymin: Minimum value on the vertical axis
Ymax: Maximum value on the vertical axis
Refresh period: Time to display on the horizontal axis of the graph
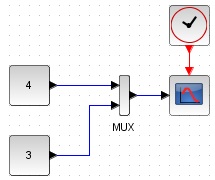
By bundling signals with a MUX block, you can display multiple data on a single graph.
■Related blocks
If you want to know about the blocks mentioned in the above explanation, click on the blocks below.

 
|
|