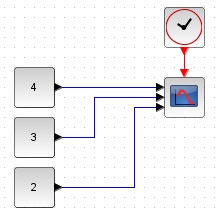
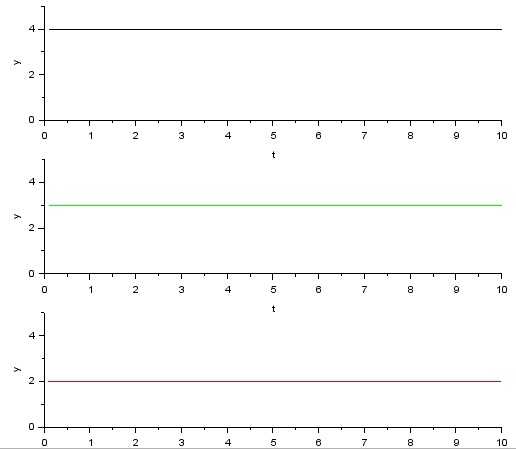
■Description
Displays the input signal on multiple graphs.
<Parameter Settings>
・Input port sizes:Define the number of input ports (signals)
・Drawing color:Specify the color of the chart. For example, 1 is black, 3 is green, and 5 is red.
・Ymin vector:Minimum value on the vertical axis
・Ymax vector:Maximum value on vertical axis
・Refresh period:Time to be displayed on the horizontal axis of the graph
To increase the number of input ports, you need to define the above parameters as a set with the same number of ports.
<Examples>
■Related Blocks
If you would like to know more about the blocks mentioned in the above explanation, please click on the blocks below.