What is a window function. Preventing leakage errors |
|||||||
- Resolution,Sampling Period ・Frequency analysis ・Fourier transform method ・DC component ・Detrending method ・Octave analysis ・Window Function |
・In Japanese
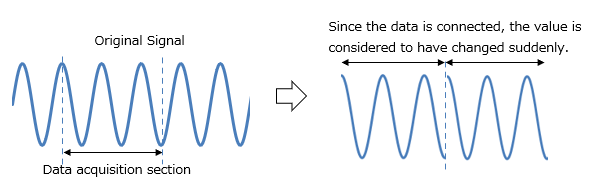
Here explains how to do frequency analysis, but frequency analysis requires the number of signals to be 2n, which is treated as a single segment of signals, so even if a signal is actually continuous, depending on the number of data selected, it will be treated as a periodic function in which the data changes suddenly, as shown below. ■Example of window function①
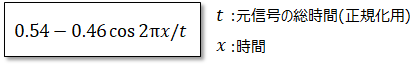
The following shows the results of comparing frequency analysis of 256 samples of a 1Hz periodic signal at 0.01 second intervals with frequency analysis of the signal with and without a window function.
The original signal without a window function has a shape like the foot of a mountain. This is called leakage error.
On the other hand, you can see that the foot of the signal with the window function added sharply converges to 0. However, the absolute value of the intensity is smaller than the signal without a window function. ■Types of window functions
Hann window ■Example of window function②
Below is a comparison of the results using the Hann window and the Hamming window. Looking at the results, the Hamming window has a stronger amplitude at the target frequency and appears to have less leakage.
This shows that there are windows that are better suited to certain signals to be analyzed.
|
|
|||||