Frequency analysis is also called spectral analysis by analyzing which frequency component waveform is included in time series data. The Fourier transform is used as the method.
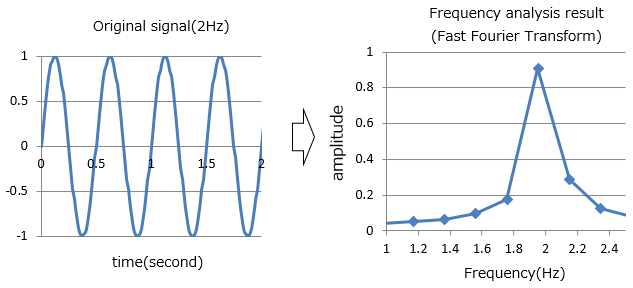
This section describes the frequency analysis method using the Fast Fourier Transform. The image when the fast Fourier transform is performed is as follows.
■How to analyze frequency using Excel
Here, I will explain how to use Excel as a frequency analysis using the Fast Fourier Transform (FFT).
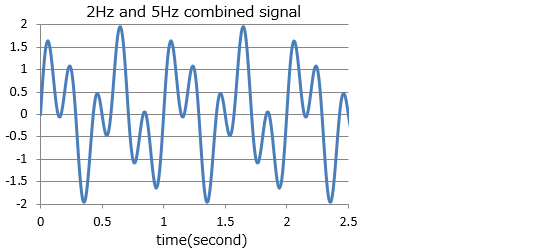
As a subject, I will deal with a signal in which 2Hz and 5Hz are combined as shown below.
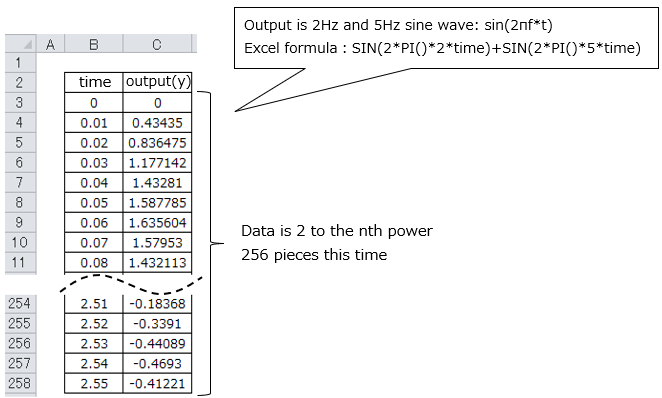
Step1. Create the data you want to analyze
Create 2Hz and 5Hz signal data as shown below. The data should be 2 to the nth power, and this time it will be 256.
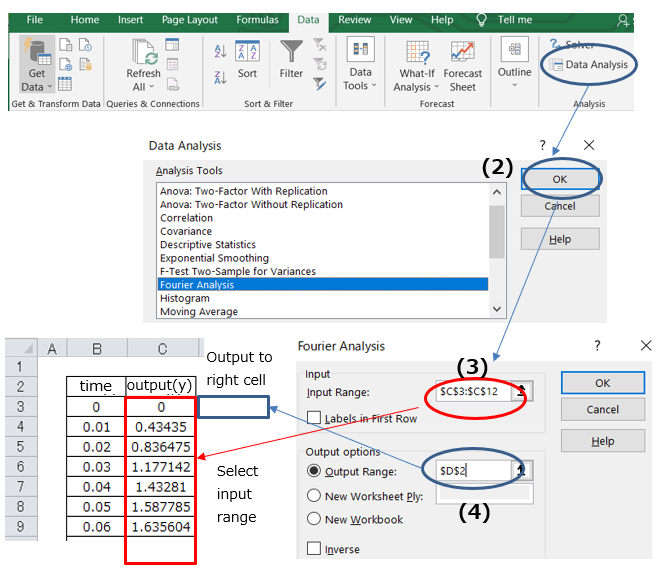
Step2. Perform Fourier transform
Perform a fast Fourier transform using the Excel function. Select "Data"-> "Data analysis"-> "Fourier analysis" as shown below and select the data created in Step1.
Here's how to use the Fourier transform formula properly without using the Excel function.
If you don't have a "Data Analysis" tab in Excel, click here.
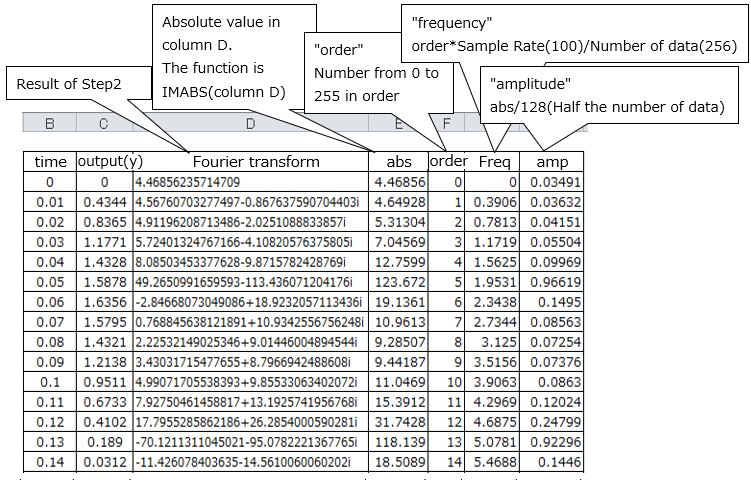
Step3. Various processing
Add the following processing to the result of Step2 , such as calculating the absolute value and frequency. What is ultimately needed is the amplitude characteristics with respect to frequency.
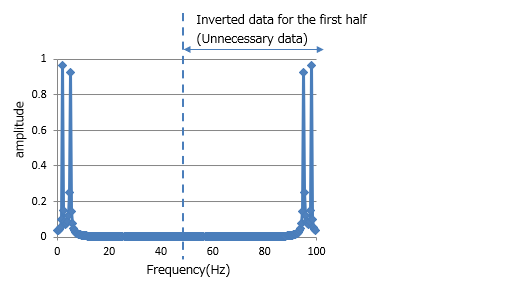
Step4. Graphing
Graphs the characteristics of the amplitude with respect to frequency. The results are as follows.
The second half of the data is the inverted data of the first half and becomes unnecessary data. This part is called a ghost.
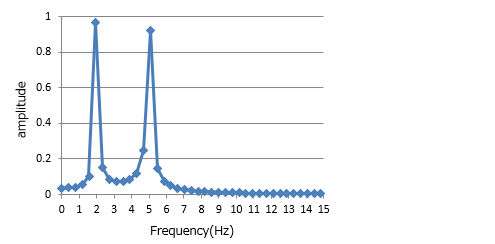
The following is the data obtained by enlarging only the first half of the data. There are strong amplitudes at 2Hz and 5Hz, and it was found that the frequency analysis was certainly possible.
■Analysis result data
The Excel data of this analysis result is here.
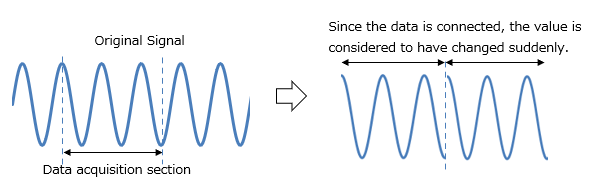
■Techniques for frequency analysis:Window function
When analyzing frequencies, the results may differ depending on where the data is separated.
Since the Fourier transform regards the data as one period when it is divided, for example, when the data is divided as shown below, it is treated as a periodic function whose value changes suddenly even though it is originally a continuous periodic function.
If this happens, the result of frequency analysis will be different, so use the window function as a means to prevent it.